
Desktop GIS
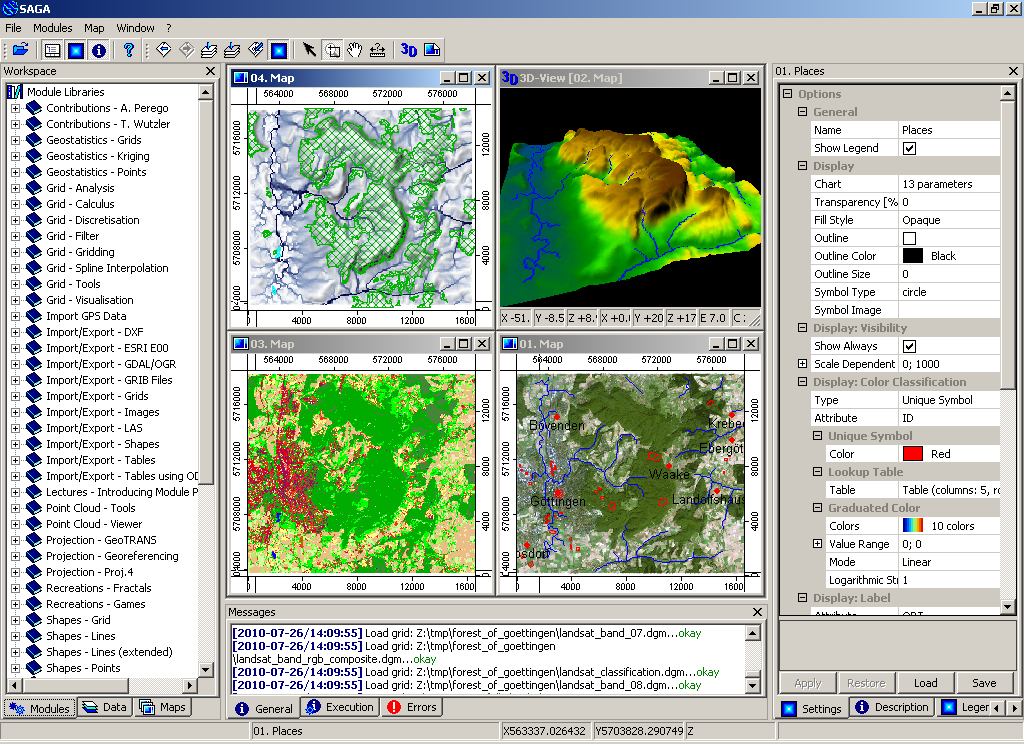
SAGA (System for Automated Geoscientific Analyses) is an open source geographic information system (GIS) used for editing and analysing spatial data. It includes a large number of modules for the analysis of vector (point, line and polygon), table, grid and image data. Among others the package includes modules for geostatistics, image classification, projections, simulation of dynamic processes (hydrology, landscape development) and terrain analysis. The functionality can be accessed through a GUI, the command line or by using the C++ API.
SAGA has been in development since 2001, and the centre of SAGA development is located in the Institute of Geography at the University of Hamburg, with contributions from the growing world wide community.
Core Features
- Access to a large number of scientific modules via the Graphical User Interface or the command line
- Import/Export to different file formats
- Reprojection/Resampling of data
- Manipulation of vector data (merging/intersection/attributes)
- Manipulation of point clouds from lidar data
- Raster data: interpolation, cost analysis, …
- Image analysis: filters, edge detection, cluster analysis, segmentation
- Digital Terrain Analysis: generate geomorphometric indexes, channel networks, profiles, contour lines, …
- Geostatistics: modules for variogram fitting and kriging
- Fast user interface for managing and visualising data
- 3D visualisation
- Straightforward C++ API for creating new modules
- Scripting through command line, bindings for python
- SAGA can be accessed from the R statistical language through the RSAGA module
Details
Website: http://www.saga-gis.org
Licence: LGPL v2.1 (api); GPLv2 (GUI and modules)
Software Version: 2.0.8
Supported Platforms: Windows, Linux, FreeBSD
API Interfaces: C++
Support: http://www.saga-gis.org
Quickstart
http://live.osgeo.org/archive/11.0/ko/overview/saga_overview.html
اطلاعات بیشتر در سایت زیر
SAGA Homepage
SAGA GIS Tutorials | rohanfisher (wordpress.com) : نمونه پروژه های انجام شده توسط
Terrain Analysis with SAGA GIS
The following video is a basic introduction to some of the digital elevation visualisation and terrain analysis tools in SAGA-GIS using SRTM data from West Timor – Indonesia.https://youtu.be/jjJY_QD4y5s. A more advanced tutorial using modelling sediment flows using Landsat 8 imagery.https://youtu.be/nwX5dBOCGYs.
Following is a short video tutorial showing and example of some terrain analysis (morphmetric) functions with SAGA GIS. This tutorial uses SRTM data for south east Sulawesi but the processing steps will be the same for anywhere.
Berikut ini adalah video tutorial menunjukkan singkat dan contoh dari beberapa analisis medan (morphmetric) fungsi dengan SAGA GIS. Tutorial ini menggunakan data SRTM untuk Sulawesi Tenggara, tetapi langkah-langkah pengolahan akan sama untuk di mana saja. https://youtu.be/48mPD8mzXiQ
Object Based Image Analysis SAGA GIS
An Object Based Image Analysis (OBIA) approach to image classification segments an image into homogenous spectral regions. Image segmentation is the process of grouping multiple adjacent pixels into polygon ‘Objects’ based on similar spectral characteristics. This differs from standard image analysis methods that classify each pixel in isolation; the OBIA approach generally produces a cleaner map product, more meaningful to human users.
Using the new ‘chain tools’ function in SAGA, that allows multiple modules to be linked into one process, the developers have created a new Object Based Image Analysis module that works beautifully.
Below is an example of using this function for classify a mine area in Sulawesi, Indonesia. https://youtu.be/aBw83S5gW2w. Another example – mapping fires in Northern Australia. – Updated April 2015 https://youtu.be/_EJyxJsUQRc. This example uses SAGA-GIS 2.2.5 to conduct a supervised OBIA segmentation based classification.https://youtu.be/584nexgW_z8. The example below shows how to map one fire event by subtracting an image after a fire from one before. The example is of a fire that escape from a mine tenure into Kakadu national park. https://youtu.be/OhcPdnW3eXc.
Saga Tool Chains
SAGA Tool Chains capability allows multiple modules to be joined together to automate and speed up complex processing sequences. Tool chains are similar to the ARC-Map model builder however instead of a graphic interface SAGA uses an xml file to join processing modules. The easiest way to start creating a tool chain is through exporting a files processing history as an xml file then editing it in Notepad ++. The process is quite easy and, as you get the hang of building chain tools, you’ll find them incredibly usefull.
The SAGA team have created a number of Chain Tools that you can investigate to get an idea of how they work. You will find them in the ‘\modules\toolchains’ folder of your SAGA installation. As I refine some of the tool chains I have been working on I’ll post them here.
I have created a short video tutorial for creating a simple tool chain for processing elevation data. The example produces a catchment area polygon file and a high erosion risk grid based on a LS Factor analysis. https://youtu.be/5yl_H92Yftc.
I have created a couple of tool chains to automate travel time scenario modelling. You can download these tool chains and access a tutorial material about how to use them here.
Reference: SAGA GIS Tutorials | rohanfisher (wordpress.com)